Key Concepts and Practical steps to your first Growth Model (for a Platform or Product)
In this post, Boundaryless explains how to set up a Growth Model and why this is essential for your digital product. An illustration a template and a video explainer are also provided to facilitate adoption.

Simone Cicero

Luca Ruggeri
Please note that there’s an update to this article with a new release of the Growth Model Template and Canvas.
Abstract
Creating a growth model is essential for today’s digital businesses. Despite this being an essential and incredibly powerful concept, especially for early-stage startups, in our practice with teams we’ve often seen them failing to have a consolidated view of their growth in one single place.
Therefore, we made a quick, practical, installment that explains a basic interpretation of what a growth model is and what the key elements needed to build one. We hope that this post can provide an orientation around this challenge including references to our recently released growth guide. In the article, you’ll find a visual explanation and a spreadsheet template, together with a video explainer.
This installment is designed to be particularly useful for small, early-stage teams that believe have achieved a good Product-Market Fit and are starting to be more intentional about growth. When companies grow, working on the growth model becomes a distributed effort (several teams looking into different aspects, and metrics) and more advanced growth analytics dashboard tools are used.
This blog post and the attached template are heavily inspired by What is a Growth Model? + How to Identify Your Company’s by Segment.
Subscribe to our newsletter if you don’t want to miss a thing!!
What is a growth model?
There’s no unique interpretation of the term growth model across the industry, but for the sake of this piece, we’ll consider a growth model as a model of:
- how you acquire new users;
- how you engage with them to make them perform certain actions with the aim of driving more user acquisition;
- how to use the resources derived from your paying users to drive more user acquisition.
It’s essentially comprised of a few elements:
- the so-called growth loops you use
- the metrics you measure
- a database to measure metrics and customer acquisition through successive cohorts
- the experiments you run
A growth mode is often based on:
- a shared conceptual visualization;
- a dashboard based on a database or spreadsheet where you collect and analyze the data;
- an experimentation framework that allows you to perform high-tempo experimentation.
Essential concepts
Before we start diving deeper into the concepts let’s recall some key concepts. All these concepts are widely explained in our recently published growth guide and we’ll make some reference to it in the text to help you find more examples.
Growth Loops
Growth loops shall not be conflated with what we normally call “flywheels”. When we refer to flywheels we normally point out the mechanisms that your platform/product leverages to create attraction and defensibility.
In our growth guide (page 48) we identify three types of flywheels:
- the Core Network Effects Flywheels (CNEF) – either two-sided or one-sided these are the basic effects of attracting users to the product, based on how many users are already using it;
- the Core Defensibility Flywheels (CDF), namely brand effects and economies of scale, effects due to which a certain platform can attract more users and have better prices due to the number of users that are already active on it;
- Technical Defensibility Flywheels (TDF), namely proprietary tech development and data capture and optimization, which are mechanisms through which the platform can achieve better performance by leveraging on improved tech or data advantages, growing with size.
These flywheels are strategic, need to be designed into the product intentionally, and – in the case of the TDFs – you’ve to equip your organization to be able to leverage them (for example by developing a certain capability to use machine learning to analyze data and make smart recommendations to customers). The flywheels are related to how better the product/platform experience becomes as a direct result of more users joining your platform: it’s essentially the way you leverage network effects and translate them into a better and more defensible product.
Growth loops (covered from page 87 onwards in our growth guide) are a more general concept and describe the ways your product can generate new user acquisition. The flywheels that are strategically designed into your product are probably one of the most important growth loops – the network effects produce a magnet that makes it pressing for users in a certain ecosystem to join your platform to avoid losing opportunities. This (product-driven, network effects-driven) growth loop is normally driven by word of mouth or sometimes by the fact that it becomes hard for players to perform their business outside of your platform.
Besides the network effect-driven attraction, other growth loops exist that could also apply also to non-network-effects powered businesses. The most common growth loops that we can consider are:
- User Generated Content growth loops – namely the process by which a certain piece of content created by one user attracts another one on the platform;
- Viral growth loops – namely hacks, or characteristics that make users of your product intentionally or unintentionally end up inviting others to the product/platform
- Sales growth loops – namely how you use sales agents/sales force to acquire new customers
- Paid Marketing growth loops – namely how you paid advertising, SEM, SMM, and similar paid tactics to acquire new customers
Metrics
Another key concept worth refreshing to understand is that a growth loop is that of metrics. We covered a lot of metrics and key concepts in our growth guide (pages 100 onwards) but the most important elements you need to understand are:
- Output metrics: the key metrics that your product/platform/company wants to focus on
- Input metrics: metrics that precede and generate impacts on your output metrics and that you as a team/company can influence more easily
Sometimes, growth models are also characterized by so-called North Star metrics that somehow serve to coalesce all your output metrics into one.
Often, Output Metrics include:
- Economic indicators, typically revenues, and so-called Unit Economics such as CAC – Customer Acquisition Cost and LTV – Customer Lifetime Value
- Engagement and Retention metrics – such as MAU – Monthly Active Users (or a variation of it)
Input metrics are instead very often including
- conversion rates, churn rates…
- experience specific metrics that are related to the particular experience you offer
- liquidity metrics, when you have a marketplace or application ecosystem, indicators that can tell you how much a certain buyer can easily find a certain seller
Ultimately, the decision about what are your output (and input) metrics is a highly contextual decision, related to how your product is shaped and other specific elements: a SaaS-centric product may have metrics that are slightly different from a marketplace-centric one.
Cohorts
Another fundamental concept to understand for the implementation of a growth model is the concept of cohorts. The essential you need to understand is:
- a cohort is a cluster of users onboarded to the platform-marketplace in a given timeframe (there are other cohort segmentation criteria such as geography but, in the interest of building a growth model that’s the kind of cohort you’ve to think about)
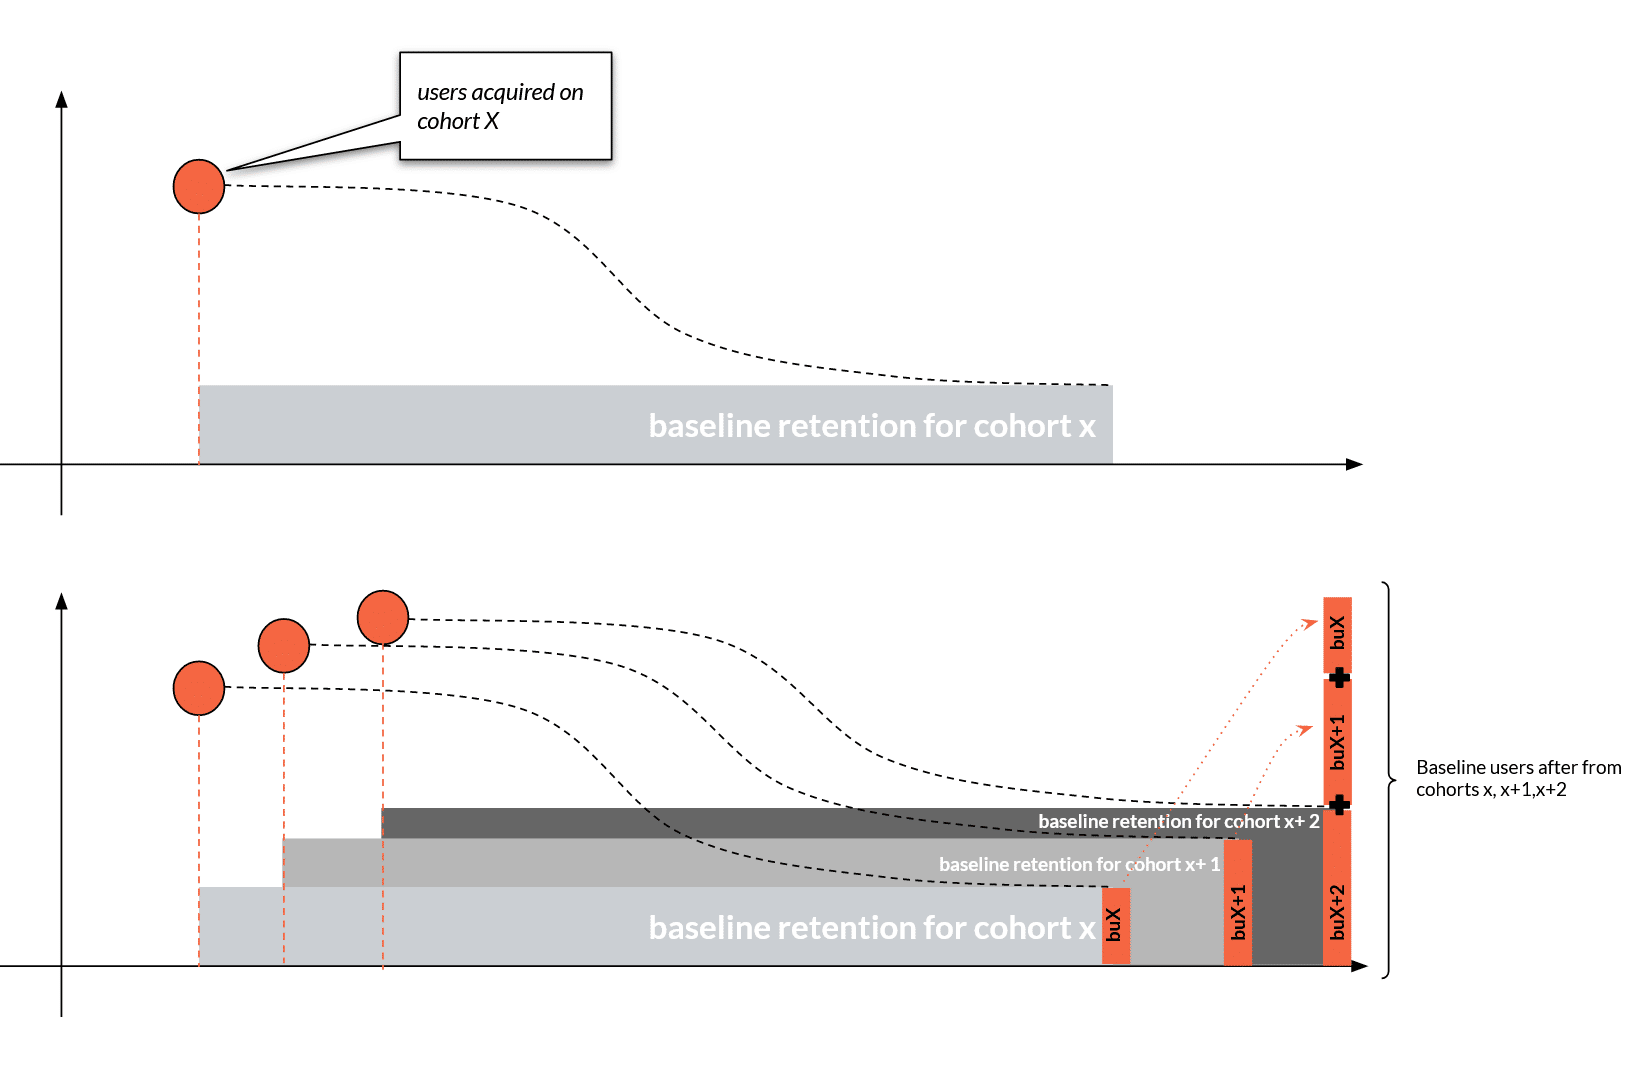
- for each cohort of new users you onboard, those users (eg: users acquired in January) will drop off the platform over the long term towards a certain baseline retention
- baseline retention changes over time (in marketplaces, cohorts will likely show more retention as network effects pick up, providing better value)
The picture below, explains the just introduced concepts visually and it’s extracted from our Growth and Product guide, where we cover cohorts as part of a growth model from page 105:
High Tempo Experiments
Another key concept that is essential to understand a growth model is the concept of high-tempo experiments. In a few words, to really improve its performance inside a growth model a team needs to be able to conduct experimentations, ideally with the same cycle as the cohort segmentation: in a few words, if you want to analyze cohorts monthly you’ll have to be able to run end to end experiments on a monthly basis.
What type of experiments are we talking about? An incomplete list may at least include:
- tweaking the product/platform experience such as modifying take rates, producing new ancillary services, tweaking pricing
- doing marketing or sales experimentations (eg: running an SMM campaign, doing an SEO sprint…)
- running one-off experiments for acquisitions (eg: run an event, or a magazine campaign…)
One interesting and intuitive framework for experimentation we are increasingly running at Boundaryless is Claudio Perrone’s Popcorn Flow but any approach that is familiar to your team would work.
Putting everything together
Let’s now try to put everything together thanks to a picture and a google sheet. Let’s assume, for the sake of completeness that you’re building a product that:
- has a target “user” of some sort of service (maybe SaaS) that has one free and one paid tier
- has a provider that is connected to the user in some sort of marketplace (you can, for example, think about an app store where ISVs provide extensions or plug-ins)
You’ve three main growth loops leading to growth:
(1) users convert to paid, generating a certain budget to be reinvested, normally you can calculate that as a percentage of the new paying user LTV minus the CAC intended as the acquisition cost of a paying user.
(2a) users (also free) have the possibility to create user-generated content that attracts new users. You can calculate a Reach Conversion factor (UGC) as RCF = civ * cr where civ = the number of visitors generated by one content item and cr = the average conversion rate of visitors reached by the content item into free users.
(2b) users (also free) have the possibility to create a viral loop (for example an invite) that attracts new users. You can calculate a K factor (UGC) as K = i * c where i= The number of viral loops sent per user c= The average conversion rate of each invite
(3) as explained above due to the network effects that are generated in the marketplace, both cross-side (buyer-seller) and same-side attraction exist.
I’m going to quote a fantastic piece on Segment’s blog (that I’ve also taken as a deep inspiration and source of materials for this post) where they explain it fairly well and that is a companion read to this post that I thoroughly suggest:
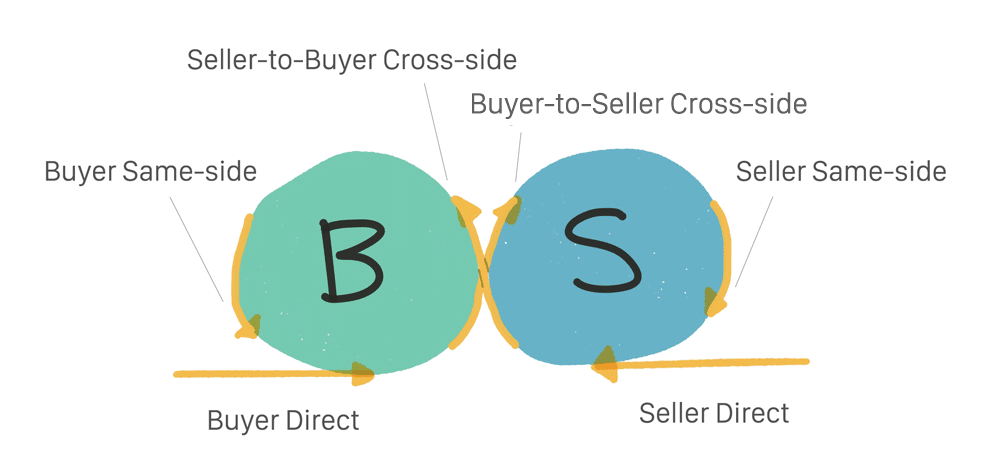
“To illustrate the reinforcing nature of growth for two-sided marketplaces, here is the set of the six key growth dynamics (ideas heavily borrowed from this HBR article):
- Buyer-to-seller cross-side: Prospective buyers tell prospective sellers that they prefer to do business on the platform. “It was hard to find your place. How come you don’t list on Airbnb?”
- Seller-to-buyer cross-side: Prospective sellers expose prospective buyers to the platform. “Buy my adorable elephant mittens on Etsy.”
- Buyer same-side: Buyers love the new transaction experience, and tell other prospective buyers to use the platform. “Why would you use a taxi? You should check out Lyft.”
- Seller same-side: Sellers love the new transaction experience, and tell other prospective sellers to use the platform. “I made a good chunk of change while I was on vacation, renting my place on Airbnb. You should try it out!”
- Direct to buyers: The marketplace tells buyers about itself directly. “Wow, Uber has a lot of billboards here.”
- Direct to sellers: The marketplace tells sellers about itself directly. “I searched for jobs in Cincinnati and found Lyft.”
In a few words, as a function of how many users and providers you’ve on the platform, you can expect organic growth on both sides, largely due to the growing perception of value and social pressure to be “on the platform”.
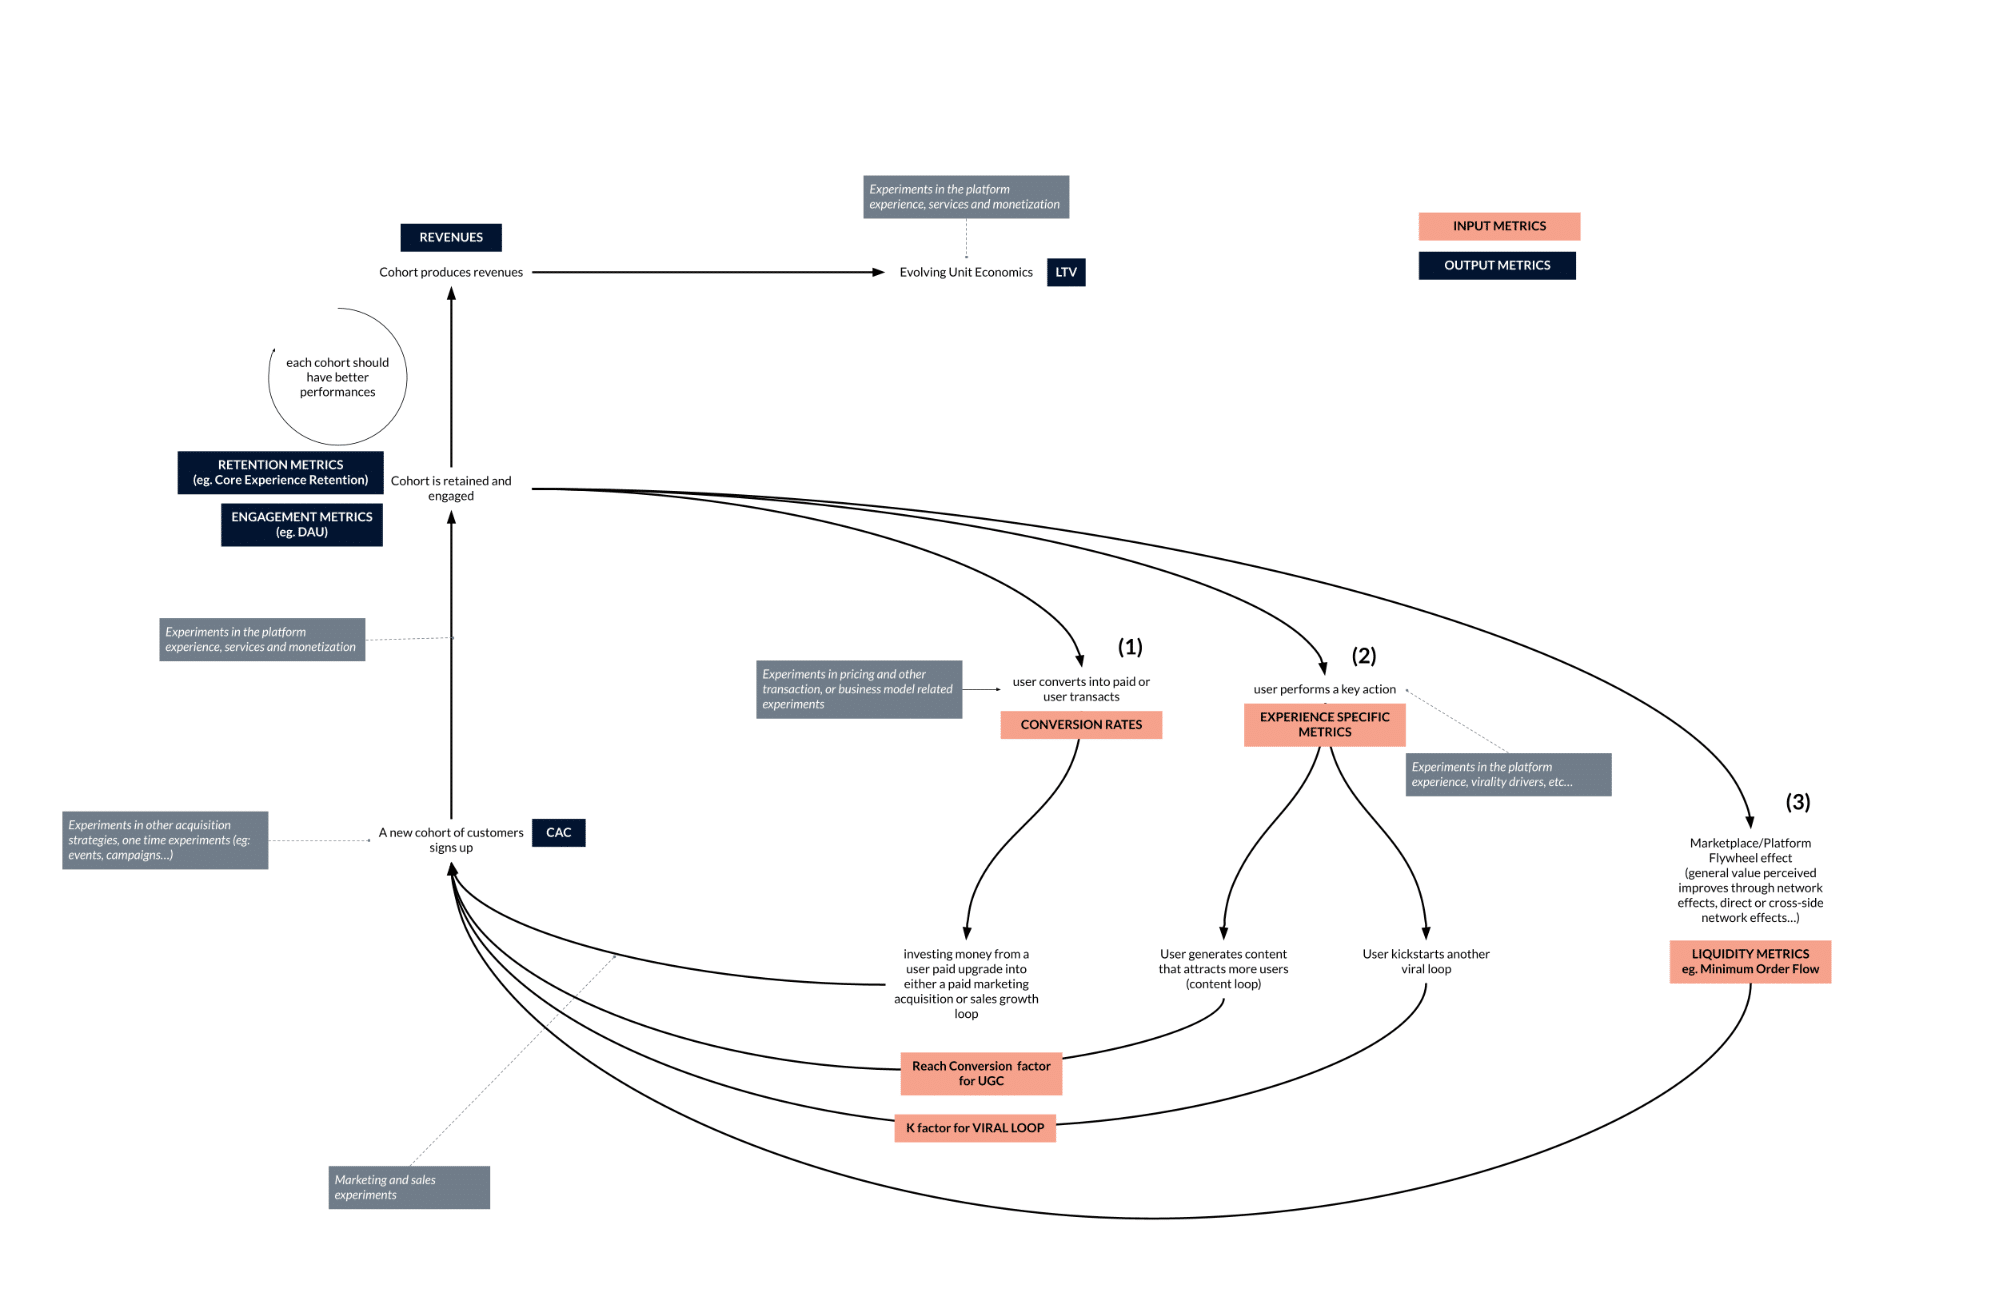
Now, let’s look at the picture below where you can see everything connected.
In pink, you have those that are normally used as “input” metrics, elements you can work on by doing experiments on the product/platform experience and marketing or sales experimentations
In dark blue instead, we see some of the most common output metrics such as cohort retention, revenues, CAC, and LTV. The places where experiments need to be run are highlighted with gray boxes and dashed lines.
The three growth loops are clearly enumerated with the numbers between round brackets:
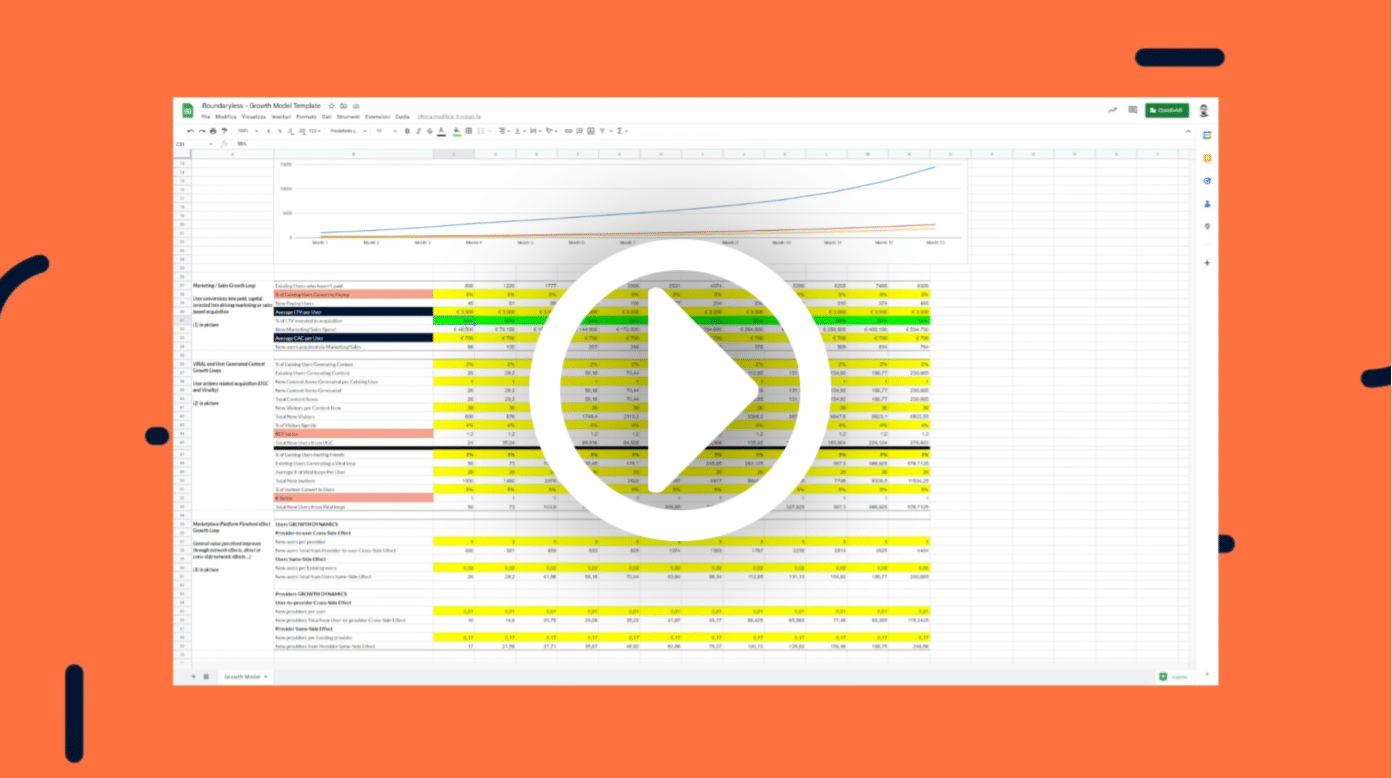
As a complement to this piece, we also provide a google sheet template, heavily inspired by the templates that the team at Segment has provided in the already cited post.
The template is constructed based on the same assumptions on the picture above, imagining that the platform/product we’re developing:
- features some sort of Viral Growth loop
- features a User Generated Content Growth loop
- sports a two-sided marketplace (user-provider)
- has a two-tier user (unpaid, paid)
As you can imagine this is not common in the digital product landscape: one example of a product that can tick all these boxes is SalesForce AppExchange:
- Viral Growth Loop: Salesforce AppExchange features a referral program that encourages users to invite others to try out the platform’s various apps and services. When a new user signs up using a referral link, both the referrer and the new user receive a reward.
- User-Generated Content Growth Loop: Salesforce AppExchange relies heavily on user-generated content in the form of app reviews and ratings. Users can also contribute to the platform by creating their own apps and submitting them for others to use.
- Two-Sided Marketplace: Salesforce AppExchange is a marketplace that connects Salesforce users with a range of third-party apps and services created by independent software vendors (ISVs). ISVs can list and sell their apps and services on the platform, while users can browse and purchase the apps and services that best suit their needs.
- Two-Tier User: Salesforce AppExchange has both unpaid and paid users. Users can sign up for free and access a range of free apps and services, while paid users can unlock additional features and benefits with a paid subscription or by purchasing premium apps and services.
In the template, you’ll see that there are three Growth Loop Sections one for each of the growth loops mentioned above. Furthermore, the template is based on 1-month cohorts and assumes – for the sake of simplicity – that user loss (due to non-retained users) only affects free users and it’s calculated as having fully played out after 3 months. The user trajectory is therefore modeled as either from Free user to Paying user or from Free user to Paying user.
In the table, you can see all the values you’ll have to measure empirically and keep updated. In green, the only one you’ve direct control over (how much of the LTV you invest into acquisition) all the rest is computed as a result.
Again, for the sake of simplicity, we’re assuming in the template that they stay constant, but your objective with the help of experiments will be to improve them. As an example, you’ll want to improve the number of existing users converting to paying by improving your communication with existing users or the attractiveness of paid features.
Check out this quick explanation video to start tweaking the model for your needs or using it for didactic or simulation purposes.
Conclusions
In this post, we tried to summarize what a Growth model is: a concept that doesn’t have a truly shared understanding yet in the industry. We also explained why this is critical for any digital product based on a platform strategy. We provided an overview of the three critical elements of a growth model (Growth Loops, Metrics, and High Tempo Experiments) and of the key growth loops you may have to deal with (user-generated content, virality, paid acquisition through marketing and sales, and native, network effects driven loops).
We also provided an illustration of how the process works and an all-rounder template you can start from to customize your Growth model by having a head start.
If you need help understanding your growth challenges you may enjoy reading this past article and you can reach out through the form below to seek help: we provide growth optimization workshops and help founders and teams with iterative experimentations which help focus around the important things and streamline the path to market validation and growth.
Simone Cicero