Achieving and measuring growth: Part 4 of a series on The Macro-Problems and Techniques of Platform Design
In this fourth post of a series on the macro problems of platform design, we explain how to establish a growth engine for a digital product/platform, and measure its effectiveness and evolution over time.

Simone Cicero

Luca Ruggeri
Abstract
Last year has been quite a year for Platform Design Toolkit and in general for methodological updates here at Boundaryless. In 2022 we indeed released:
- a new guide and canvases set – the Platform Growth and Product Guide
- one key update to one of the Guides, the addition of the Arena Scan to the Platform Opportunity Exploration Guide
- one new structured framing of what Value Propositions one can build in Platform-Ecosystem settings and a new Canvas that allows you to describe your VPs in this way – the Platform Strategy Model Canvas
- one new update of the 3EO Toolkit now includes an adoption guide to help you embark on the process of unbundling your organization into entrepreneurial, autonomous, and accountable teams
In this series of posts, we are progressively offering an updated, dashboard-like, view on the Platform Design Toolkit and explaining all the modular techniques that make it the most versatile methodology to date to design, experiment, and grow platform strategies. We’ll explain how it can be used by designers, and entrepreneurs and also, later on, highlight its connection with the 3EO Toolkit for organizational evolution and with other strategic design and validation techniques that we often use in combination.
Subscribe to our newsletter if you don’t want to miss a thing!!
Let’s start from the basics: what can you do with Boundaryless open-source methodologies? Our methods can help designers and entrepreneurs engage with at least six macro problems:
- Understanding Ecosystems to create the right Value Propositions
- Defining the Platform Experience, and Flywheels for Defensibility
- Defining the Go-To-Market and Liquidity approach
- Achieving and measuring growth (this post)
- Validating key assumptions along the way
- Executing and evolving the organization
To support such work, we use different combinations of our canvases and heuristics: some of these canvases are more mature than others, and some are still “experimental” and will be released in the coming months as we did with others in the past. In many cases, we also experimented with other complementary techniques.
Note that we see these macro-problems as circularly related, and not necessarily to be seen as a step-gated process, we, therefore, assume that a team will have to come back and forth on these problems. We’re currently developing a new experience format called Platform Design Sprint that will be launched in 2023 that will help teams go through these phases on a continuous journey – subscribe here to be kept up to date as soon as the program launches.
Today’s post covers the challenges and techniques related to the fourth macro-problem, that of Achieving and measuring growth. The inaugural post can be found here.
To receive timely updates related to the other four macro-problems please subscribe to our newsletter here.
Achieving and measuring growth (MP3)
Macro-Problem Description
Entrepreneurs building a platform/marketplace grapple with the macro challenge of growth. This problem involves the first step of identifying suitable growth loops/channels based on the product’s characteristics. This could mean leveraging virality for social platforms or a content loop for a user-generated content site. The chosen growth strategies, in turn, dictate which metrics they’ll track, whether it’s a viral coefficient, content engagement, or user retention. Eventually, entrepreneurs have to create a so-called growth model. This is crucial, as it serves as a growth roadmap, and helps outline user acquisition, monetization, and retention strategies. This process necessitates constant iteration and validation, with each component of the model shaping the other, making growth a complex yet integral puzzle to solve.
What are the key questions you need to answer?
Typical questions one needs to ask in this phase are:
- On what engines of growth should resources be invested?
- How should I choose what to measure?
- How can I connect investments, experiments, and metrics and track evolution over time?
When you are supposed to work on this
Building a solid engine of growth is a problem that teams have to confront as soon as problem-solution fit is demonstrated. As long as your product can technically sustain growth – you’re out of the prototype phase – you should be thinking about key aspects of your customer experience you want to measure and how they fit and resonate with your financial and economic model. Your objective needs to be to make a credible abstraction of how your product grows, and how changes you make to the product (and other experiments in marketing and beyond) impact the customer in terms of customer acquisition, retention, and engagement.
What techniques to use, and how can the tools help?
Three key techniques that can be used in this phase are:
- Implementing the Growth Loops – picking from the growth loops library TQ 4.1
- Choosing the Metrics to track – with the help of the Metrics Library TQ 4.2
- Setting up a Growth Model – with the Growth Model Template TQ 4.3
Let’s see the details below on how canvases and other tools can help you achieve this.
Choosing and Implementing the Growth Loops – picking from the growth loops library (TQ 4.1)
We could argue for a long about what comes first between designing the product, choosing the metrics, and choosing the growth loop or channel but let’s assume that choosing the growth loop/channel is strongly contextual to designing the product. The general idea of a growth channel/growth loop is that of a channel through which, by investing your resources, you can generate new user acquisitions.
We’ll use the definition of growth loop/growth channel almost interchangeably in this post.
There are lots of growth loops available here’s a quick breakdown:
- Viral Growth Loops: This is a mechanism where existing users bring in new users in a self-sustaining cycle. For example, a user may invite others to join a platform (like Facebook or WhatsApp), and then those new users, in turn, invite more users, thereby creating a loop of continuous growth.
- Paid Acquisition / Paid Marketing: This is a growth strategy where businesses spend money on advertising to attract new customers. This can take many forms, including search engine advertising, social media advertising, display ads, etc. The aim is to effectively spend money in a way that the lifetime value of the customers acquired is higher than the cost of acquisition.
- UGC / Content Loop: “UGC” stands for User-Generated Content. In this growth loop, the content created by users attracts more users. For example, on a platform like YouTube, users upload videos (content), which in turn attracts viewers who may become content creators themselves, further fueling growth.
- Virality: Similar to viral growth loops, virality is a phenomenon where users share something about a product or service with their network, leading to a rapid increase in awareness and usage. It’s often associated with “word-of-mouth” marketing. Viral content or products spread quickly because they are shared extensively within social networks.
- Sales: This traditional growth channel involves direct selling to customers. It can involve personal selling, where a salesperson meets with a customer face-to-face, or it could be over the phone, via email, or even through an automated online sales system. The effectiveness of the sales channel often depends on the quality of the sales team and the sales process.
- Product-Led Growth: here, the product itself is the primary driver of customer acquisition, conversion, and expansion. In this model, the value of the product is demonstrated before a purchase decision is made. Examples include freemium models like Dropbox or Slack, where users can start using the product for free and then upgrade for more features or capacity.
The inner workings of these growth loops/channels are covered widely in our Growth and Product Guide (page 87 onwards) except for the product-led growth loop/channel which will require a guide on its own. In the meantime we at Boundaryless produce a structured PLG guide extension, you can rely on Elena Verna’s continuous stream of knowledge or on Leah Tharin’s excellent recap.
An important consideration to make – while choosing growth loops – is to consider the nature of the product and ensure there’s a fit between the product and the growth loop. Brian Balfour covered this topic in his seminal essay Product Channel Fit Will Make or Break Your Growth Strategy. The key message Balfour provides in the post is that: “Products are built to fit with channels. Channels do not mold to products” in essence, “You control your product, you do not control the channel. So you need to change the things within your control to fit with the things that you do not control.”
In Balfour’s essay channels are essentially superimposed to growth loops as a concept, and the product must resonate with a certain channel/growth loop to acquire a product-channel fit. In his words for example for a product to be able to work with a virality loop, the product needs to be able to:
- deliver Quick Time To Value because for virality to work the viral cycles need to be short.
- deliver a Broad Value Proposition because it needs to be appealing to a large percentage of a user’s network
- and the product ideally needs to improve with network effects
Similarly, for a product to enjoy ad-based paid marketing, it needs to be able to deliver quick time to value because “users have less patience to find value when coming from an ad”. The point here is clear: you should always verify and question the ability of the product you’ve built with the acquisition channel/growth loop you plan to use and see how they resonate.
Another key point that Balfour suggests to consider is that you shouldn’t spread out too many channels because channels tend to deliver value according to a Pareto distribution: i.e. the most important channel delivers most of the value.
Implications and dependencies
Working on your growth loops is contextual to your product design: to some extent, the product will dictate the growth loop you can use, or – more specifically – the growth loop you plan to use will dictate how you shape and tune your product accordingly. It’s therefore essential that you approach growth loops with at least a PSM (Platform Strategy Model) in mind, while also having the Platform Experience clear may be essential to dive deeper into the user behavior as part of the loop.
Choosing the Metrics to track – with the help of the Metrics Library (TQ 4.2)
Before approaching choosing metrics to focus on, you’ll have to have identified that customers have shown appreciation for the product, that the product solves the customer’s problems that there’s a relevant market that you can target, and that you can target acquisition through a certain set of growth loops.
As Brian Balfour would say, you’re reasonably sure that your product has a “model-market” fit, i.e. that – if you nail distribution and customer acquisition – you can get to a sustainable 100M+ market: now your mission is to grow, and you think you’ve consistency between the product and the growth channel.
More in detail – and even before thinking about model-market fit, you must have developed a credible product idea, and you’ll be able to define how your customer experiences the product and what are the key metrics that will allow you to understand if your product is doing well in the hands of the customer.
As loyal readers know, at Boundaryless we believe that a strong platform strategy delivers a (not always complete) mix of value propositions: a core product function (often as a SaaS), a potential marketplace on top of it, and a potential developer ecosystem for the development of extensions and – depending on the configuration of your product – you’ll have to track metrics across this spectrum.
At this point your objective is to identify what metrics you want to track – normally along this frame:
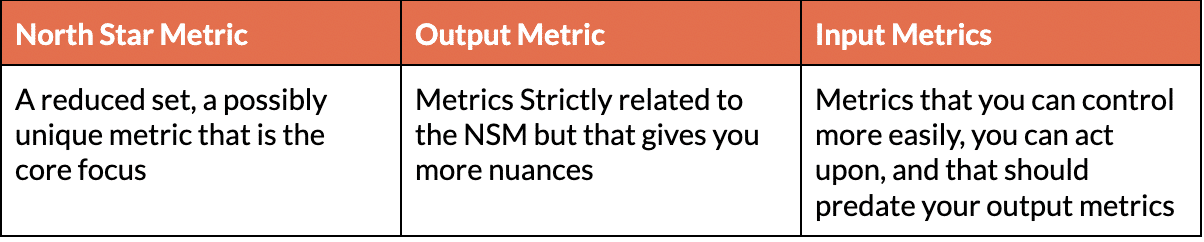
Essentially, a North Star Metric is the most important of your output metrics or a combination of those.
Lenny Ratchiskly has a tremendous post on choosing one or more NSMs for your business and provides a breakdown of North Star Metrics (and thus output metrics you can choose from) along six lines:
- Revenue (for example, Annual Recurring Revenue, Gross Merchandise Value),
- Customer growth (for example, paid users, market share),
- Consumption growth (for example, messages sent, nights booked),
- Engagement growth (for example, Monthly Active Users, Daily Active Users),
- Growth efficiency (for example, LifeTime Value / Customer Acquisition Cost, margins, Payback period, that is, “how long does it take for a customer to generate more contribution margin than the cost to acquire them”), and
- User experience (for example, Net Promoter Score).
In our growth and product guide, we also touched on the topic, with a particular focus on platforms and marketplaces, and we characterized Output Metrics a bit more simply, as either:
- Economic indicators (Revenues, Unit Economics such as CAC and LTV),
- Engagement (such as Utilization rates, Active Users, etc…)
- Retention metrics (such as User Retention, Churn rates, and more).
In the last few months, following the end of easy capital, and as a consequence of much broader attention to profitability and economics, the Payback period has become an increasingly important metric – especially as an output metric – and can also be a good NSM, at least for certain periods when the focus is on growth, for businesses that count on paid acquisition as the main engine of growth. Generally, a good payback period is considered to be around 6 months.
Input metrics, on the other hand, very often include metrics that are experience specific – for example the rate of conversion from a free to paid plan – that are related to the particular experience you offer to the user. You can normally thus impact input metrics more easily, with experiments and changes and experiments in marketing, UX, pricing, and similar aspects. Especially for marketplaces, liquidity metrics, indicators that can tell you how much a certain buyer can easily find a certain seller (e.g. Time to Fill) are also good input metrics (predate the success of the marketplace).
Our Growth guide allows you to pick metrics based on the type of marketplace (Double-commit, Buyer-picks, Marketplace picks…) and also to look into metrics from the marketplace perspective being able to choose metrics from both sides, supply and demand, clearly with a more careful eye towards the side of the marketplace you’re constrained on. Find a recap on the Metrics Library on page 104 of our Growth and Product guide.
Ultimately, though, the decision about what are your output (and input) metrics is a highly contextual decision, related to how your product is shaped and other specific elements: a SaaS-centric product may have metrics that are slightly different from a marketplace-centric one.
Here are a couple of examples:
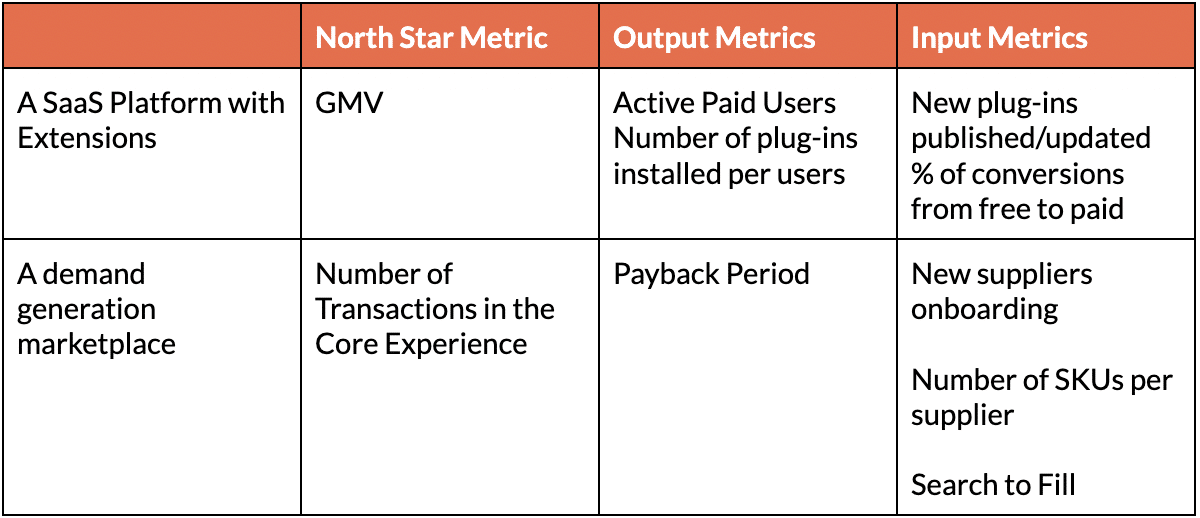
Overall, metric frameworks abound and it’s therefore advisable to keep a focus on the overall approach.
Implications and dependencies
It’s generally advisable to work on metrics identification after you’ve reached product-market fit and contextually to having identified your growth loops.
Setting up a Growth Model – with the Growth Model Template (TQ 4.3)
This last technique is what you’ve to use to coalesce together your product-growth loop fit, and the metric that you choose with your experimentation cycles and cohorts. We recently released a dedicated piece on growth models titled: Key Concepts and Practical Steps to your first Growth Model (for a Platform or Product) that also contains the Growth Model Template, a basic spreadsheet you can use t structure your growth model.
In this piece, we’ll focus mainly on guiding adopters in applying this technique more operationally.
In our framing a growth model as a model of:
- how you acquire new users and – through your growth loops – potentially engage them to perform certain actions with the aim of driving more user acquisition;
- how you use your resources (derived from your paying users) to drive more user acquisition.
It’s made of:
- the growth loops/channels you use (see above)
- the metrics you measure (see above)
- a database to measure metrics and customer acquisition through successive cohorts
- the experiments you run
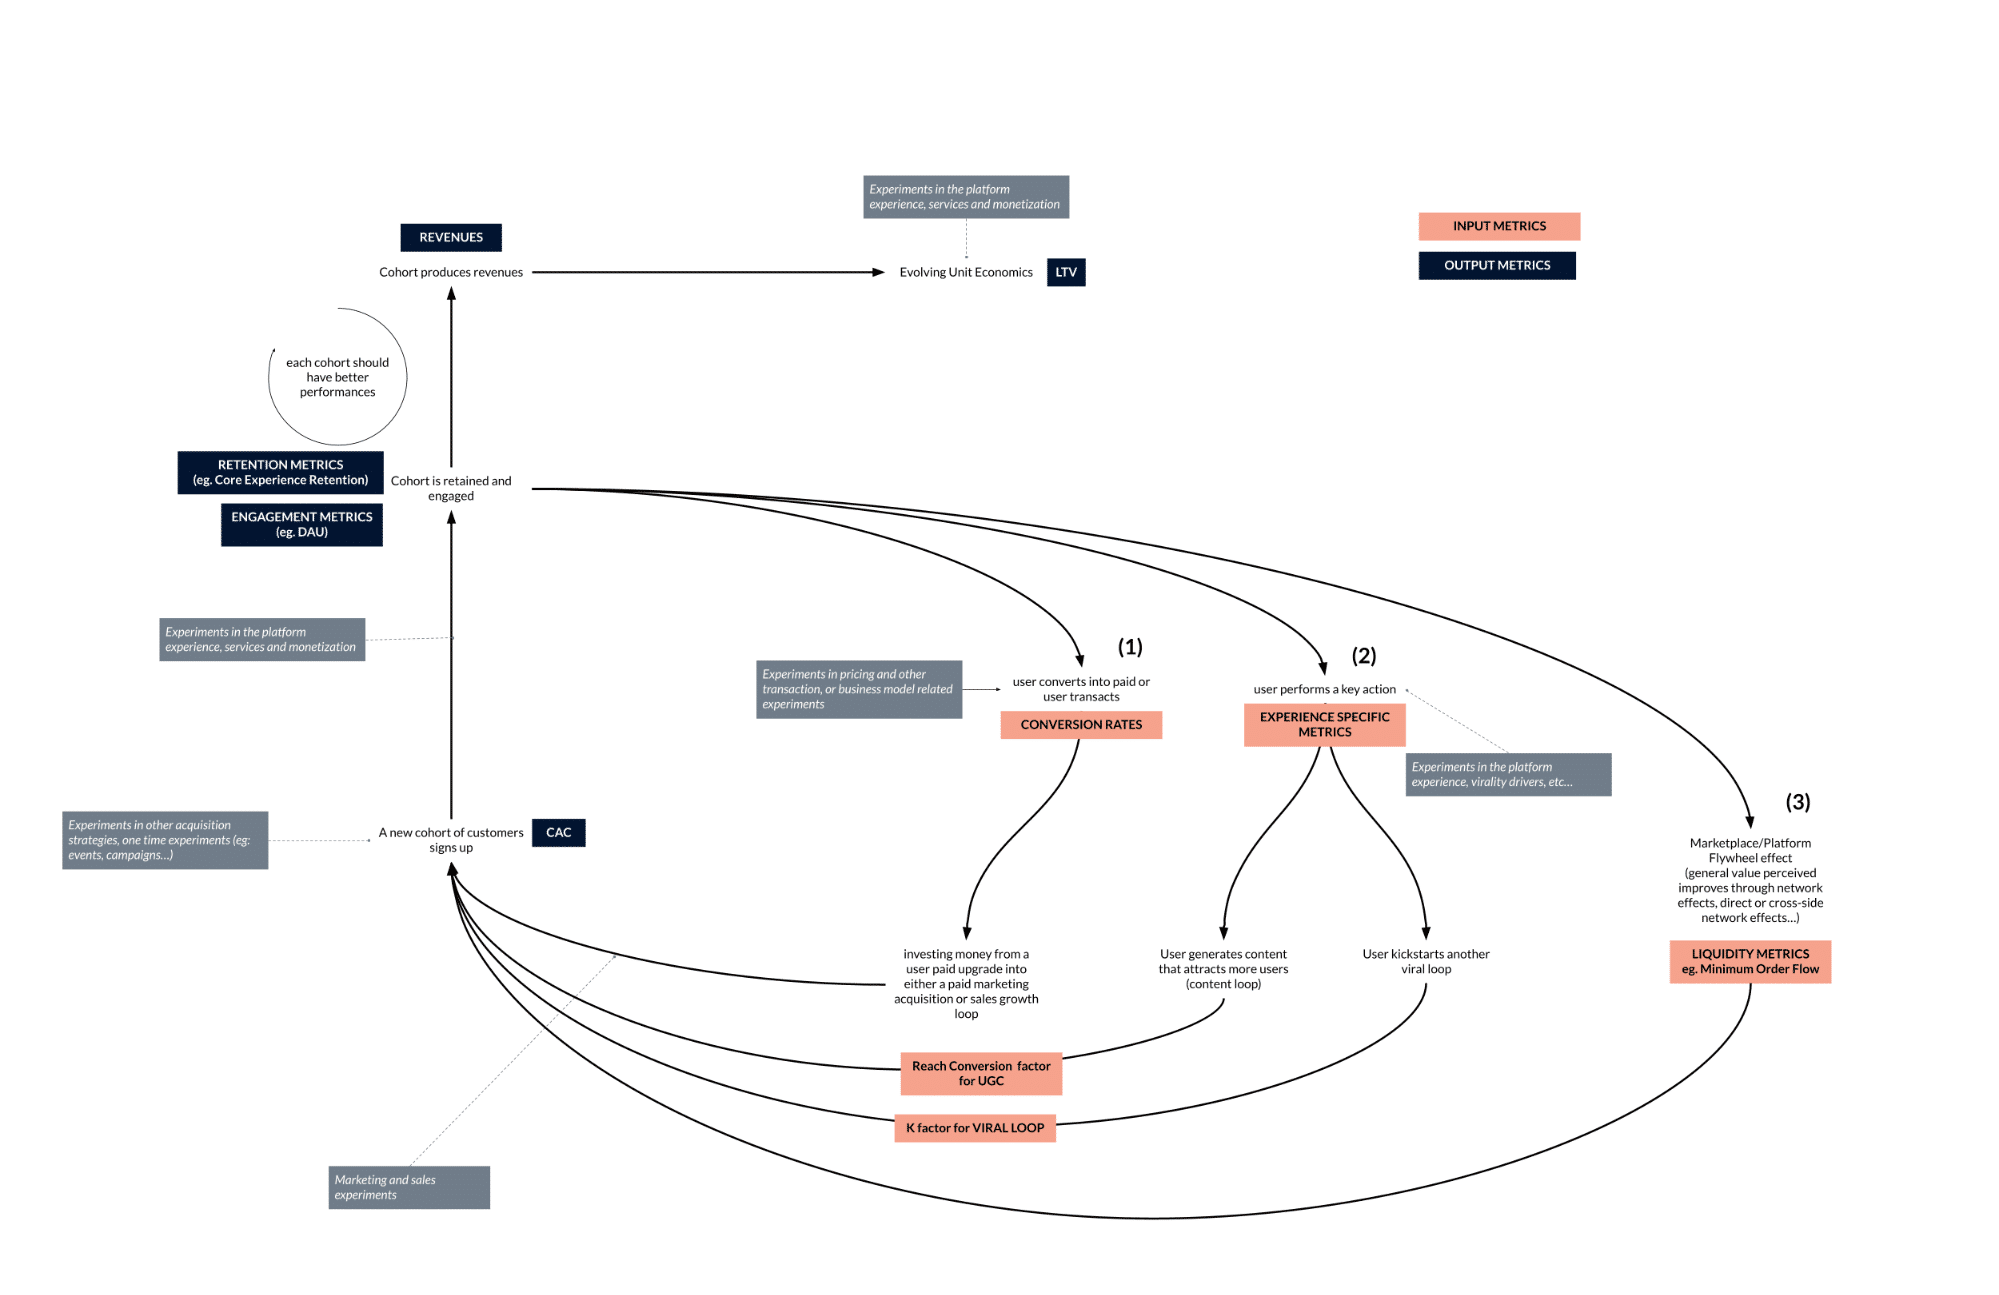
Operationalizing a growth loop is about connecting all these pieces together. As one can see below the key idea is to model and measure how newly acquired users are engaged to generate:
- conversion from free to paid (through product-led dynamics)
- a viral action or the creation of a piece of content that attracts more users
- an impact on liquidity generating a better perception of network effects.
- more value-generating impacts
In turn, these elements would likely generate new user acquisitions. Key input metrics are normally centered around the “cycles” on the right of the picture below – you can impact on an input metric mainly by tweaking the product experience, pricing, and similar elements. Output metrics are, instead, substantially the impacts that such actions have on the retention and engagement metrics, or the economics (eg: the payback period or the CAC/LTV).
Running a growth model means measuring these metrics over a cohort structure and being able to measure how experiments and changes affect the growth performance across cohorts: the objective is to be able to see how tweaks improve numbers and – over the long term – also develop a certain type of predictability over the impact that certain actions will generate.
A well-structured growth model should be able to forecast growth and scalability by considering factors such as market size, customer acquisition cost, customer lifetime value, and retention rates. For example, one could develop a model of how the launch of the service would spread in a new canonical unit (e.g. a new city for geography-depending services – see here for more details) and thus use such modelization for planning.
It’s important to note that growth models are not one-size-fits-all, they should be tailored to a company’s specific situation and can evolve as the business grows and changes.
Implications and dependencies
Working on the growth model should be the culmination of your first product cycles: as soon as you have a working product that can sustain growth, you’ve chosen your growth loop and identified your key metrics you’re in a position to acquire an experimental framework, express such framework in cycles coordinated with cohort acquisition and set up your growth model to start extracting insights from it.
Conclusions next steps
In this fourth release of a series, we presented the list of 5 macro-problems that platform entrepreneurs have to approach when developing a platform strategy and bringing it to market. These macro-problems are:
- Understanding Ecosystems to create the right Value Propositions
- Defining the Platform Experience, and Flywheels for Defensibility
- Defining the Go-To-Market and Liquidity approach
- Achieving and measuring growth (this post)
- Validating key assumptions along the way
- Executing and evolving the organization
For the fourth one Achieving and measuring growth, we show in this post three key techniques that should be used. It’s advisable to use these techniques together. Creating and implementing the growth model cannot leave aside having identified the growth loops and – based on those and other considerations – having identified as well the set of metrics. Essentially executing and measuring the evolution of the growth model is a way to “operationalize” growth loops and metrics and use them to move forward, learn and improve both your product design and your acquisition strategy.
If the implementation of the growth model cannot prescind from the steps before (growth loops and metrics) being able to think about the fit between your product and the growth loop has usefulness on its own, as well as identifying the set of NSM, Output and Input metrics. Pushing them together inside the growth model is just the most important step you and your team can take to improve your predictability, capacity, and financial planning.
In the coming weeks, we will release two more posts, focused on the other 2-macro problems.
To stay tuned on:
- the release of four further deep dives
- updates on the new techniques we use and are releasing, especially regarding validation
- the release of the Platform Project Work Board (a digital tool that will allow you to track your work project-wide)
- and the opening of the inscriptions to the Platform Design Sprint, a new format where we will help you adopt these techniques to bring your own project forward
Subscribe to our newsletter here.
Simone Cicero